AWS AgentCore Part 2: Adding Memory, Context, and GitHub Integration to Multi Agent

This is part two of a two part series on multi-agent systems with AgentCore.
Part 1: Building a Multi-Agent Error Debugger with AWS Bedrock AgentCore
In Part 1, we built a multi-agent error debugger with AgentCore. It works. Parses errors, checks for secrets, figures out root cause and generates fixes. But it’s got a fundamental problem — it forgets everything.
Every analysis starts from scratch. Same error hits twice? Full analysis both times. Your team solved this exact bug last week? Doesn’t matter, the system has no idea. That’s heaps of wasted compute.
Today we’re fixing that. Adding memory so it learns, external context so it’s not working in a vacuum and stats tracking so you can spot trends before they become incidents.
All source code: github.com/JeremyRitchie/agentcore-error-debugger
Table of contents
- Table of contents
- Why Memory Matters
- Architecture Changes
- AgentCore Memory
- Context Agent
- Stats Agent
- GitHub Integration
- Updated Supervisor Workflow
- Feature Flagging
- Results
- Conclusion
Why Memory Matters
Here’s the scenario. Your team hits a ECONNREFUSED error connecting to PostgreSQL. The system analyses it, determines root cause (database not running or wrong port) and suggests a fix. Nice!
A week later, someone else hits the same error. Without memory the system starts over. Same tools, same reasoning, same result. That’s like googling the same thing twice a week. We’ve all done it, but an AI system shouldn’t have to.
With memory the flow changes:
1. New error comes in
2. Search memory → "I've seen this exact pattern before"
3. Return cached analysis with previous solution
Done in seconds instead of minutes
But it’s more than caching. Memory lets the system spot patterns across your whole team’s errors. Solutions that worked before get reused. Fixes get validated over time. Combine that with Stats tracking (a separate agent) and you can catch error spikes before they become incidents.
Architecture Changes
Here’s what we’re adding to Part 1:
Architecture Diagram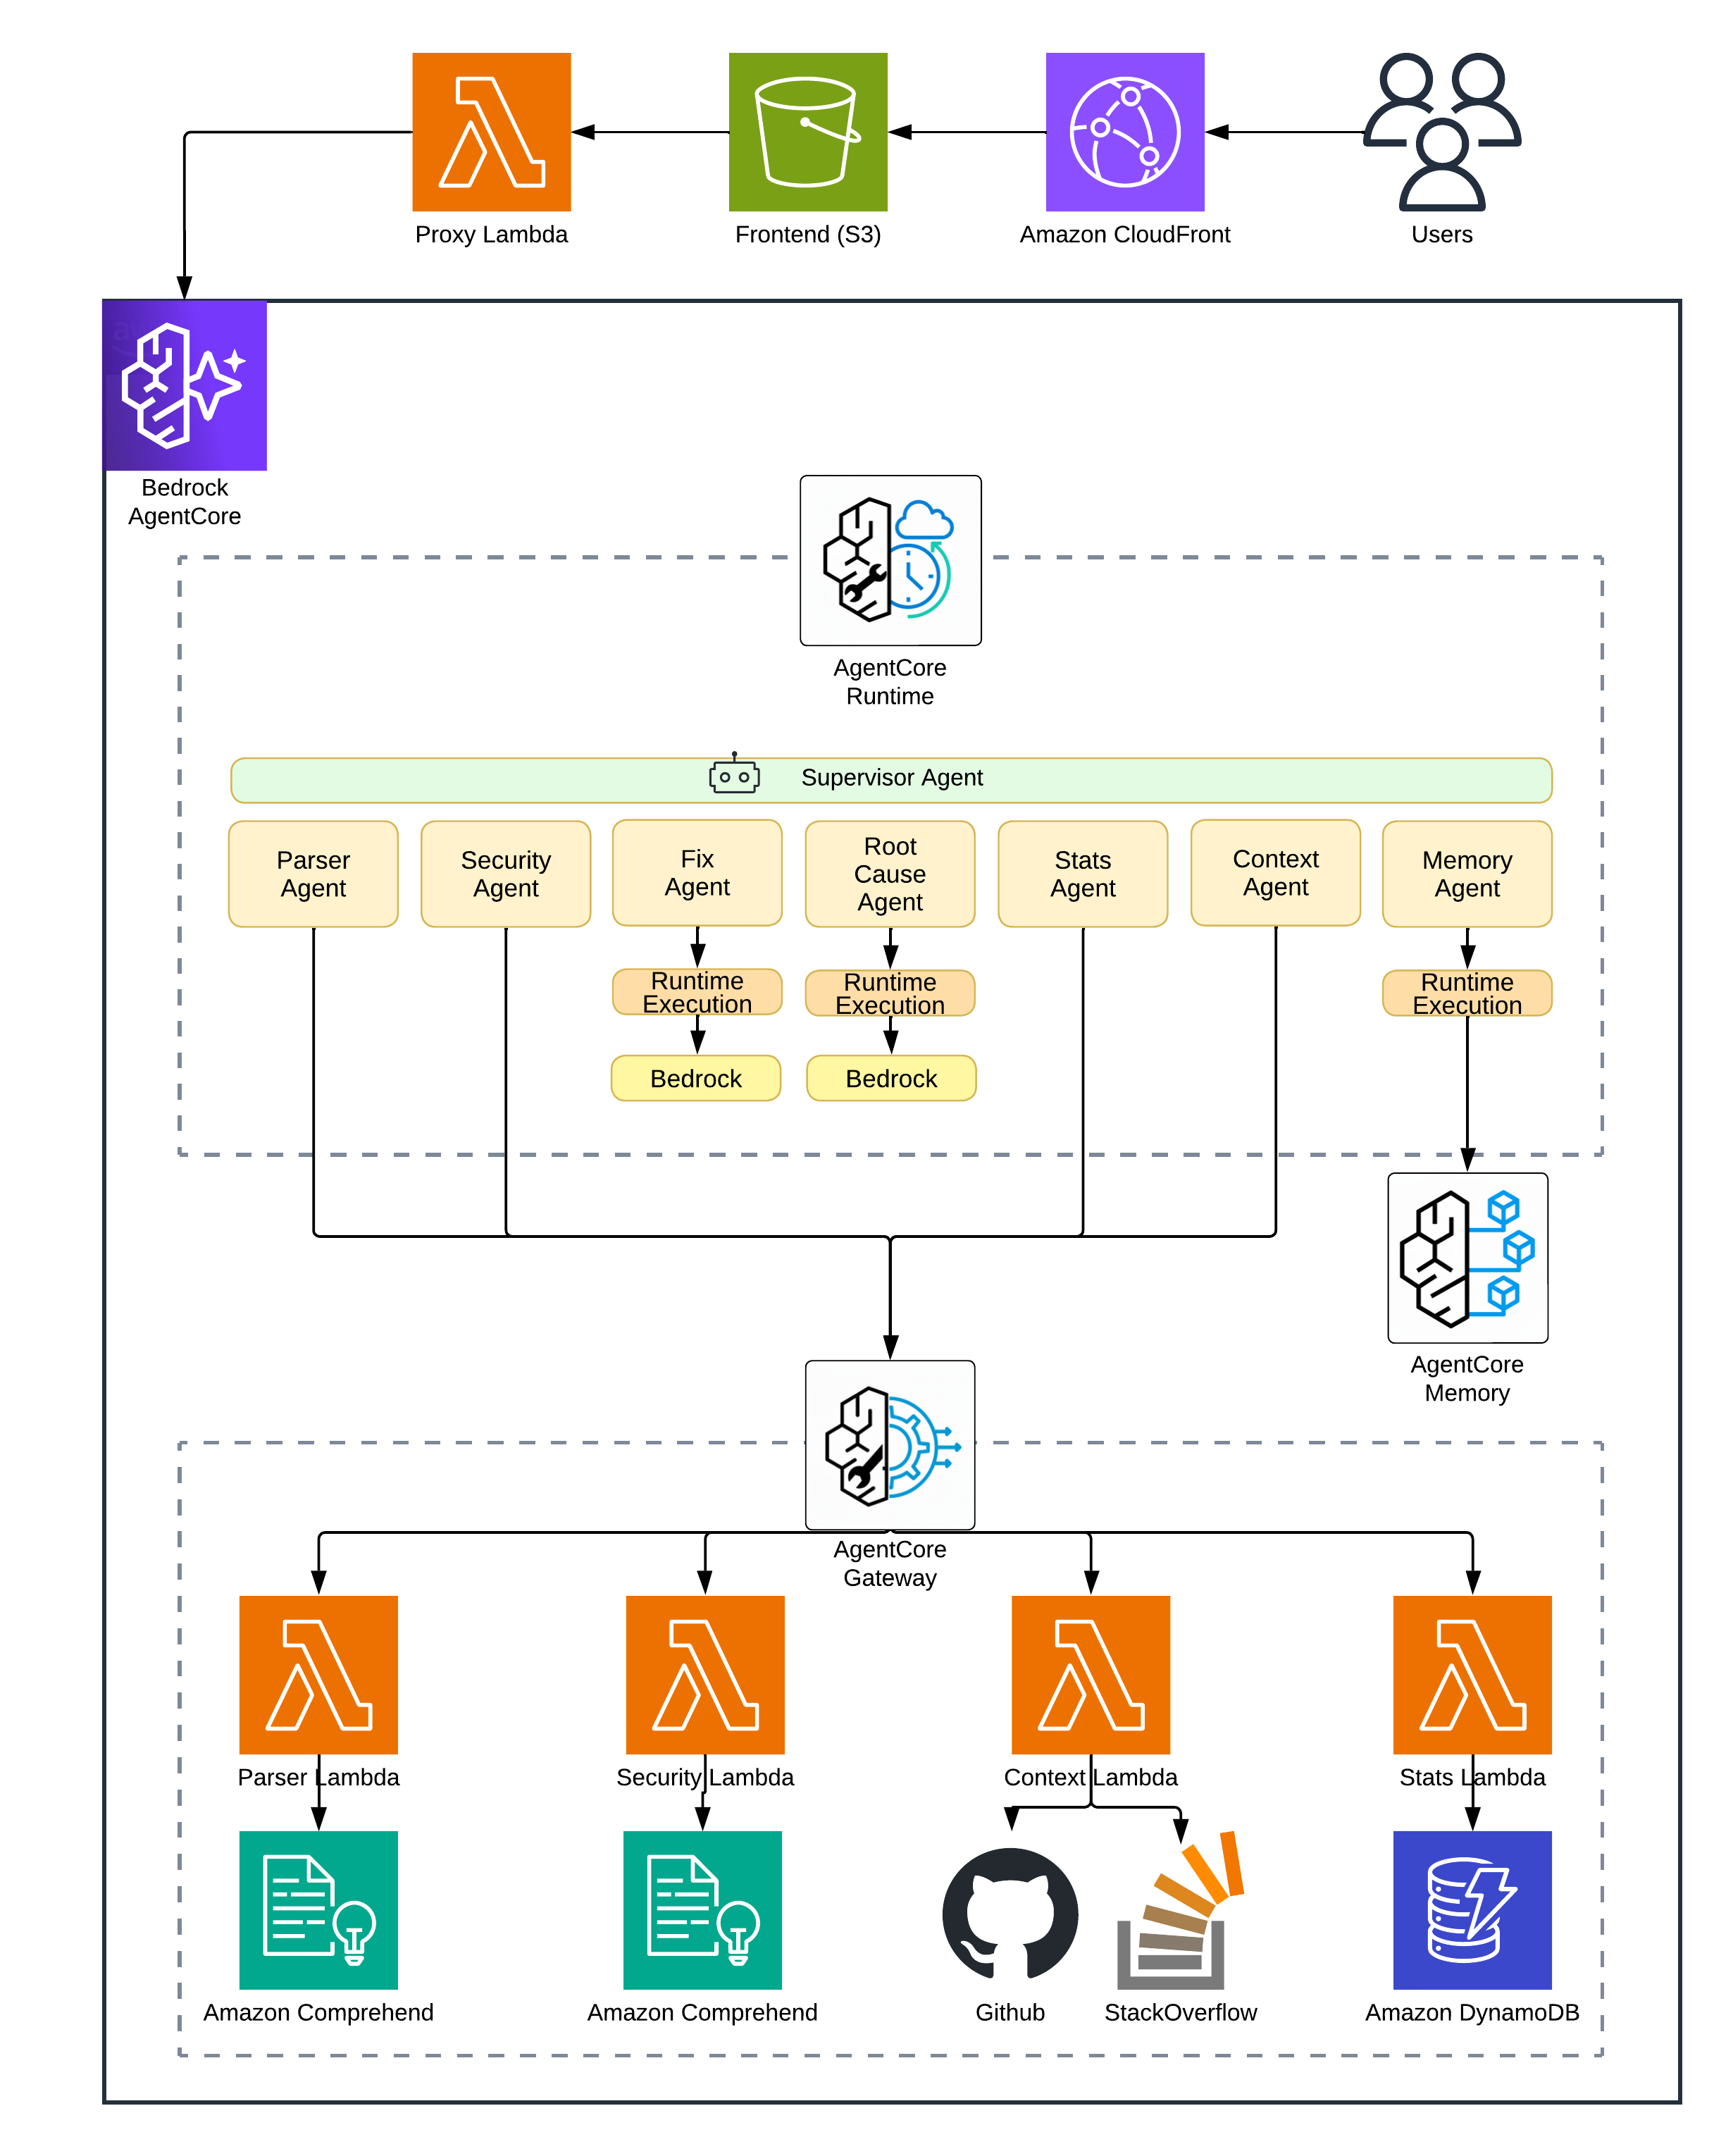
| New Component | Purpose |
|---|---|
| AgentCore Memory | Vector storage for error patterns with semantic search |
| Context Lambda | GitHub Issues and Stack Overflow API integration |
| Stats Lambda | DynamoDB read/write for error frequency |
| DynamoDB Table | Persistent storage for trend tracking |
The Supervisor now runs a four-phase workflow instead of Part 1’s simpler loop:
Phase 1: Information Gathering
  ├─ Parser → structured error data
  ├─ Security → PII/secret check
  └─ Memory → similar past errors (might have instant solution!)

Phase 2: External Research (if needed)
  ├─ Context → GitHub Issues, Stack Overflow
  └─ Read File → source code from GitHub repo

Phase 3: Reasoning
  └─ Root Cause → with ALL accumulated context

Phase 4: Solution & Learning
  ├─ Fix → generate code solution
  ├─ Stats → record occurrence
  └─ Store → save pattern to memory
More moving parts, but each one earns its place.
Part 2 app — live architecture view mid-analysis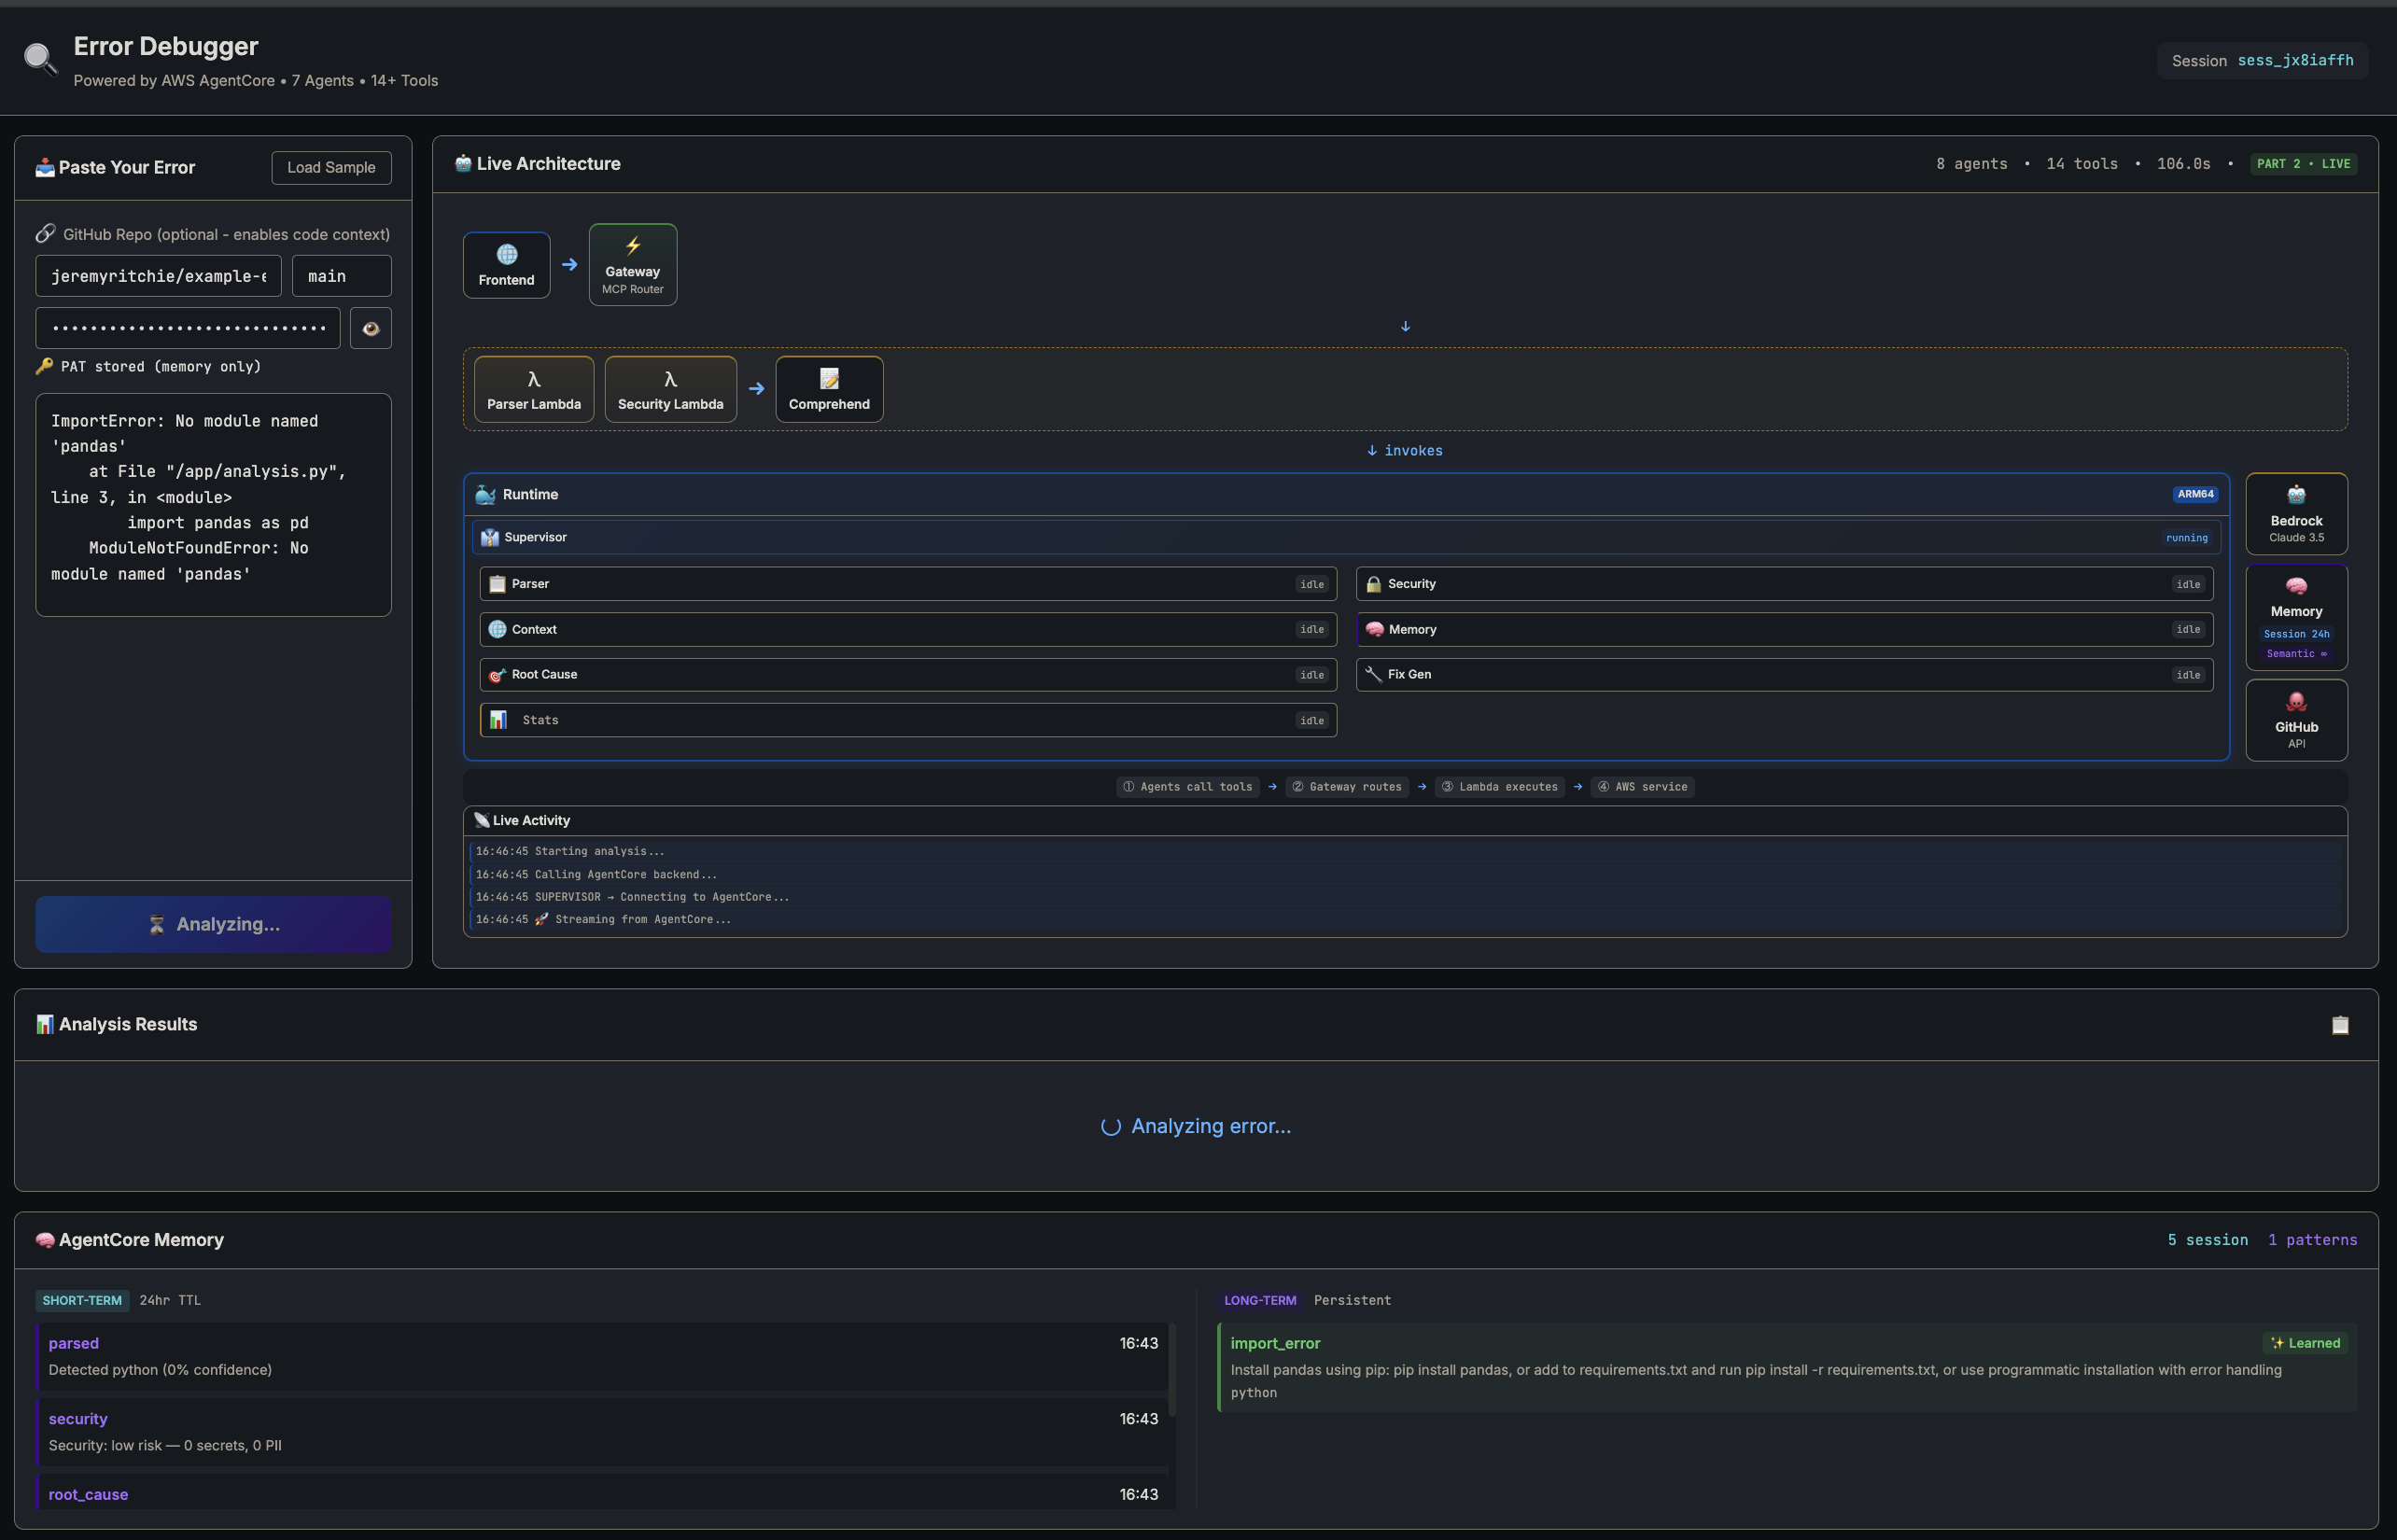
AgentCore Memory
AgentCore Memory is AWS’s managed vector database for agents. Store documents with embeddings, query by semantic similarity. Think Pinecone or Weaviate but baked into AgentCore.
How It Works
When you store an error pattern, Memory generates an embedding vector from your text, stores it alongside your metadata and indexes it for fast retrieval.
When you search, your query gets embedded and Memory finds the closest vectors using cosine similarity. Returns matches with relevance scores.
Here’s the bit that makes it useful: “connection refused on port 5432” matches “PostgreSQL ECONNREFUSED” even though they share almost no words. Semantic search understands meaning, not just keywords.
Deploying Memory
resource "aws_kms_key" "agentcore" {
  count = var.feature_part >= 2 ? 1 : 0

  description             = "KMS key for Error Debugger AgentCore encryption"
  deletion_window_in_days = 7
  enable_key_rotation     = true
}

resource "aws_bedrockagentcore_memory" "main" {
  count = var.feature_part >= 2 ? 1 : 0

  name = replace("${local.resource_prefix}_memory", "-", "_")

  event_expiry_duration = 30  # days (7-365 range)

  depends_on = [aws_kms_key.agentcore, aws_cloudwatch_log_group.memory]
}
AgentCore Memory Console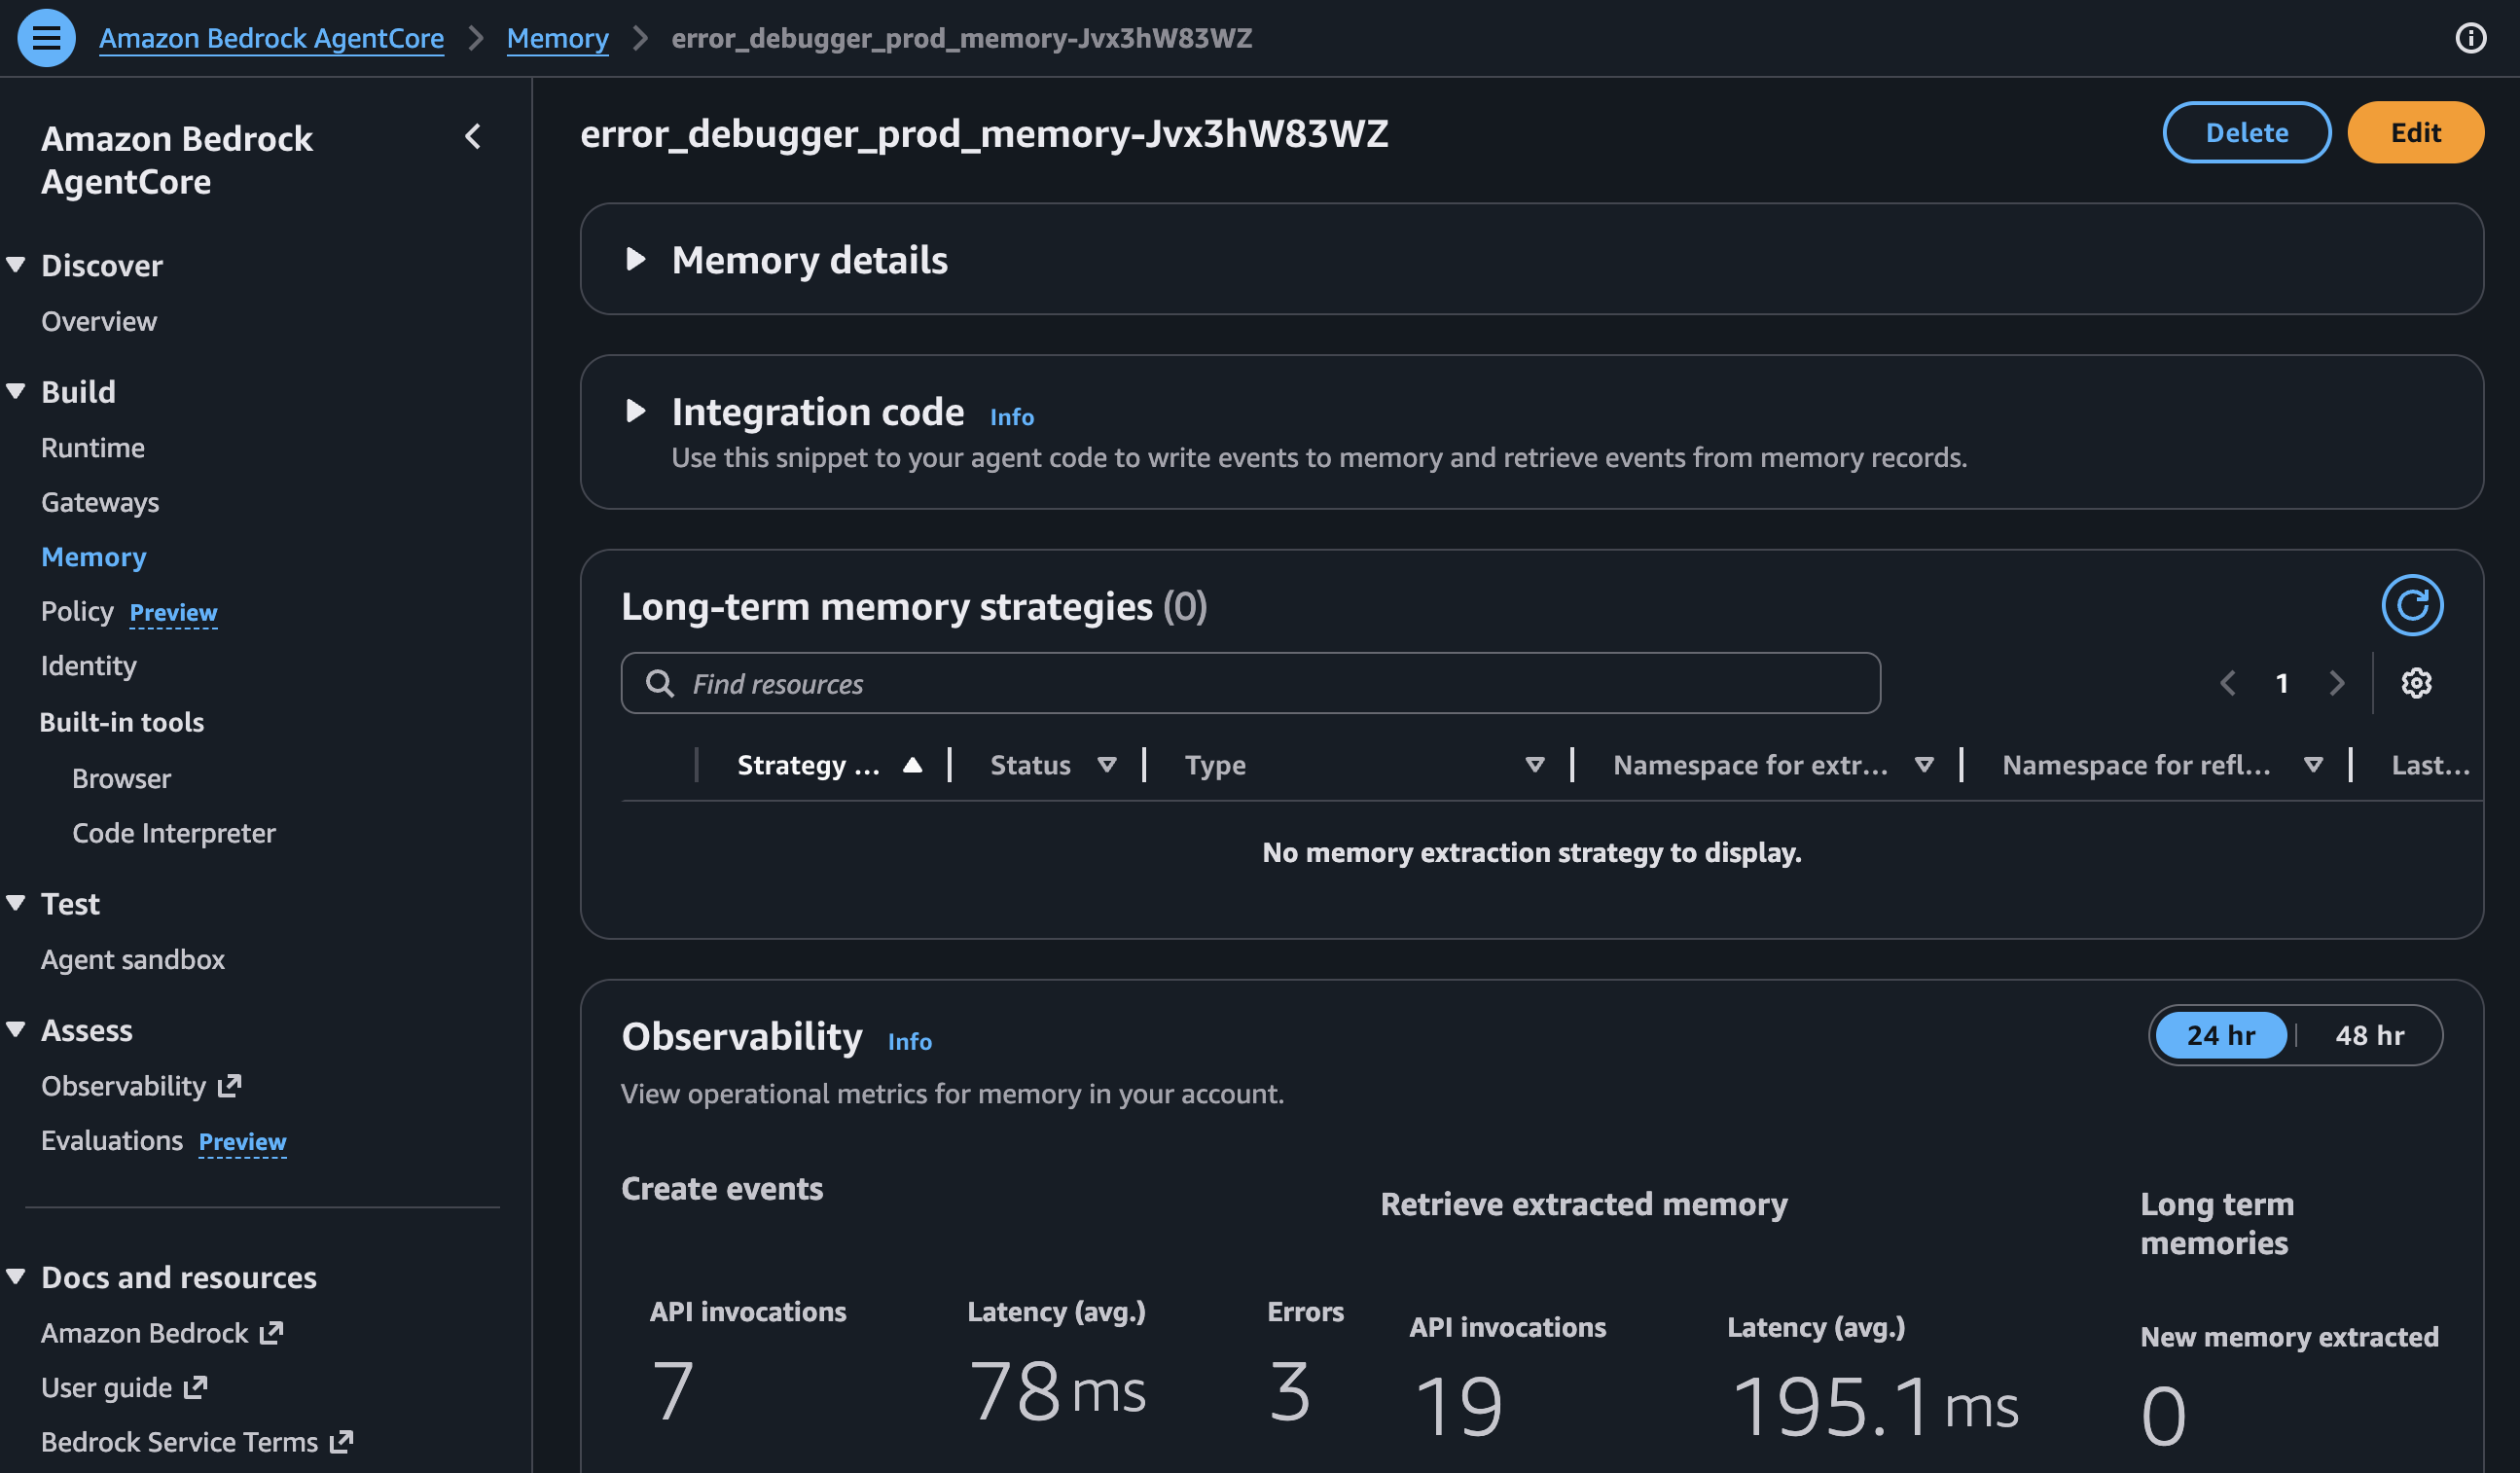
Memory supports semantic search over long-term pattern storage. I originally tried using it for short-term session context too, but stale data from previous analyses kept polluting new ones. Ended up using a local Python dict for session state (reset on every request) and keeping Memory purely for persistent error patterns. Simpler and more reliable.
The count conditional means Memory only gets deployed when feature_part >= 2. More on that in Feature Flagging.
Memory Tools
The Runtime needs tools to talk to Memory:
@tool(name="search_similar_errors")
def search_similar_errors(error_text: str, limit: int = 5) -> str:
    """Search LONG-TERM memory for similar past errors."""

    response = bedrock_agentcore.retrieve_memory_records(
        memoryId=MEMORY_ID,
        namespace=MEMORY_NAMESPACE,
        searchCriteria={
            "searchQuery": error_text,
            "topK": limit,
        },
    )

    results = []
    for record in response.get('memoryRecordSummaries', []):
        score = record.get('score', 0)
        # API scores are 0.0-1.0; convert to 0-100
        score = int(score * 100) if score <= 1.0 else int(score)

        if score < 50:  # minimum relevance threshold
            continue

        parsed = parse_record_text(record.get('content', {}).get('text', ''))
        results.append({
            'error_type': parsed.get('error_type'),
            'solution': parsed.get('solution'),
            'relevance_score': score,
            'success_count': int(parsed.get('success_count', 1))
        })

    return json.dumps({
        'results': results,
        'has_solutions': any(r.get('solution') for r in results),
        'best_match_score': results[0]['relevance_score'] if results else 0,
    })
The API is retrieve_memory_records with searchCriteria — it returns memoryRecordSummaries ranked by cosine similarity. I store patterns as structured text (error type, root cause, solution) so the semantic search matches on meaning, not just keywords.
The relevance threshold took some tuning. Too low and you get false matches — “NullPointerException” matching every Java error ever. Too high and you miss useful patterns. I started at 70, dropped to 50 after testing showed I was filtering out valid matches. Your mileage may vary.
Context Agent
The Part 1 system is self-contained. Sweet for obvious errors, but what about edge cases? Framework-specific bugs that the internet solved two years ago?
The Context Agent searches GitHub Issues and Stack Overflow. If someone else already hit your error, you get their solution for free.
GitHub Issues Search
The search uses GitHub’s Issues API. Key thing is extracting good search terms from raw error text — otherwise you’re searching for noise:
@tool(name="search_github_issues")
def search_github_issues(error_message: str, language: str = "") -> str:
    """Search GitHub Issues for similar error reports."""

    key_terms = _extract_search_terms(error_message)
    query = " ".join(key_terms[:5])

    search_query = f"{query} is:issue"
    if language:
        search_query += f" language:{language}"

    url = f"{GITHUB_API_URL}/search/issues?q={urllib.parse.quote(search_query)}&sort=updated&per_page=10"

    headers = {
        'Accept': 'application/vnd.github.v3+json',
        'User-Agent': 'ErrorDebugger/1.0'
    }
    if GITHUB_TOKEN:
        headers['Authorization'] = f'Bearer {GITHUB_TOKEN}'

    request = urllib.request.Request(url, headers=headers)
    with urllib.request.urlopen(request, timeout=10) as response:
        data = json.loads(response.read().decode('utf-8'))

    issues = []
    for item in data.get('items', [])[:10]:
        issues.append({
            'title': item.get('title', ''),
            'url': item.get('html_url', ''),
            'state': item.get('state', ''),
            'comments': item.get('comments', 0),
            'labels': [l.get('name', '') for l in item.get('labels', [])[:3]],
        })

    return json.dumps({"query": query, "issues": issues[:5], "source": "github_issues"})
A couple of things worth noting. _extract_search_terms pulls the most meaningful keywords from the error text — strips noise words, prioritises error-specific identifiers and keeps the query targeted. Without it, you’d search for “the file at line 42 has an error” instead of “TypeError undefined property”. The Bearer auth format is required for GitHub’s fine-grained personal access tokens and the User-Agent header is mandatory per their API policy.
Stack Overflow Search
Same approach, different source. Stack Overflow’s API is surprisingly decent for programmatic search:
@tool(name="search_stackoverflow")
def search_stackoverflow(error_message: str, tags: str = "") -> str:
    """Search Stack Overflow for related questions and answers."""

    key_terms = _extract_search_terms(error_message)
    query = " ".join(key_terms[:5])

    params = {
        'order': 'desc',
        'sort': 'relevance',
        'intitle': query[:100],
        'site': 'stackoverflow',
        'pagesize': 10
    }
    if tags:
        params['tagged'] = tags.replace(',', ';')
    if STACKOVERFLOW_API_KEY:
        params['key'] = STACKOVERFLOW_API_KEY

    query_string = urllib.parse.urlencode(params)
    url = f"{STACKOVERFLOW_API_URL}/search/advanced?{query_string}"

    request = urllib.request.Request(url, headers={'User-Agent': 'ErrorDebugger/1.0'})
    with urllib.request.urlopen(request, timeout=10) as response:
        data = json.loads(response.read().decode('utf-8'))

    questions = []
    for item in data.get('items', [])[:10]:
        questions.append({
            'title': item.get('title', ''),
            'url': item.get('link', ''),
            'score': item.get('score', 0),
            'is_answered': item.get('is_answered', False),
            'accepted_answer_id': item.get('accepted_answer_id'),
            'tags': item.get('tags', [])[:5],
        })

    return json.dumps({"query": query, "questions": questions[:5], "source": "stackoverflow"})
The Context Lambda combines both sources and ranks results. Closed GitHub issues with lots of comments get boosted — if 50 people discussed it, there’s probably a fix in there. Stack Overflow answers with accepted solutions get priority. Solved problems are more useful than open questions.
Stats Agent
Right, now for the numbers side.
Memory tells you “I’ve seen this before.” Stats tells you “I’ve seen this 47 times this week, up 300% from last week.”
That distinction matters. A suddenly increasing error usually means a deployment gone wrong, an upstream service failing or infrastructure degradation. Knowing the trend changes how you prioritise the fix.
DynamoDB Schema
Nothing fancy. Single-table design with partition key grouping by error type:
resource "aws_dynamodb_table" "error_stats" {
  name         = "${var.prefix}-error-stats"
  billing_mode = "PAY_PER_REQUEST"
  hash_key     = "pk"
  range_key    = "sk"

  attribute {
    name = "pk"
    type = "S"
  }

  attribute {
    name = "sk"
    type = "S"
  }

  ttl {
    attribute_name = "ttl"
    enabled        = true
  }
}
Each error gets a record with pk as partition key (like ERROR#connection_error to group by type) and sk as sort key using ISO8601 timestamps for time-range queries. TTL auto-deletes after 90 days. No point keeping stale data around.
I went with PAY_PER_REQUEST billing because error analysis is bursty. Reserved capacity would be wasted most of the time. Same logic as choosing Lambda over EC2.
Trend Analysis
The trend detection compares two equal time windows. Current vs previous. That’s it:
@tool(name="detect_trend")
def detect_trend(error_type: str = "", window_days: int = 7) -> str:
    """Detect if an error type is trending up or down."""

    now = datetime.utcnow()
    current_start = now - timedelta(days=window_days)
    previous_start = current_start - timedelta(days=window_days)

    current_count = count_in_window(error_type, current_start, now)
    previous_count = count_in_window(error_type, previous_start, current_start)

    if previous_count == 0:
        change = 100 if current_count > 0 else 0
    else:
        change = ((current_count - previous_count) / previous_count) * 100

    if change > 20:
        trend, severity = 'increasing', 'warning'
    elif change < -20:
        trend, severity = 'decreasing', 'good'
    else:
        trend, severity = 'stable', 'neutral'

    return json.dumps({
        'trend': trend,
        'severity': severity,
        'change_percent': round(change, 1),
        'current_period_count': current_count,
        'previous_period_count': previous_count,
        'window_days': window_days
    })
Dead simple. Compare the current window against the previous window of equal size. A 20% change threshold marks trends — anything above gets a warning severity, below gets good. You don’t need fancy time series analysis for “is this error getting worse?” Save your Prometheus budget for something that actually needs it.
Memory panel and CloudWatch logs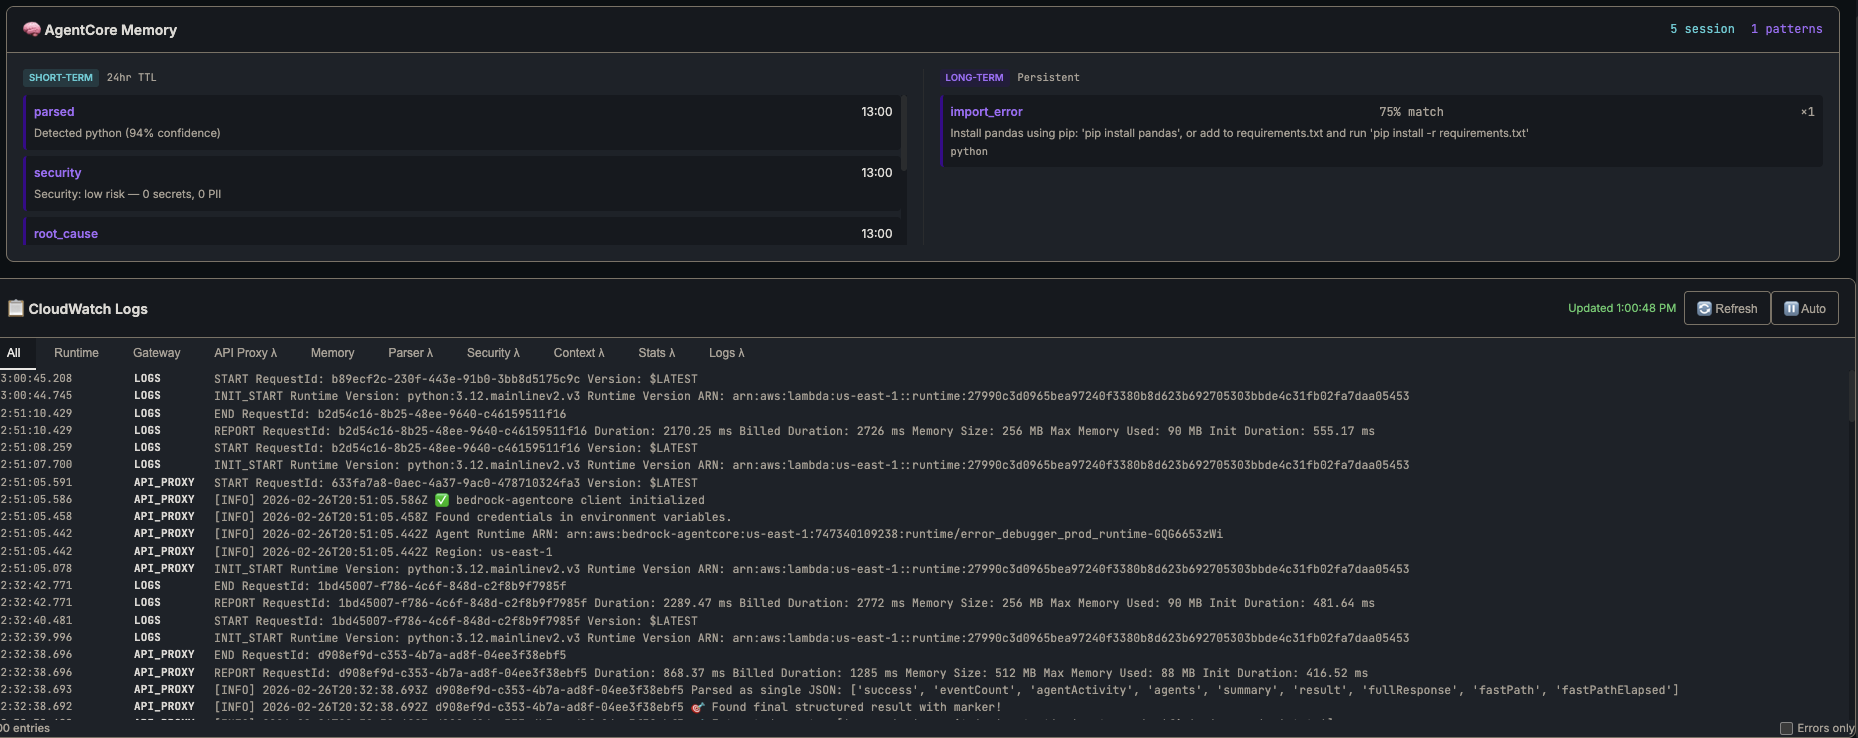
GitHub Integration
The Context Agent finds external resources. But what about your own codebase? If the error references src/api/client.ts:42, wouldn’t it be useful to actually read that file?
@tool(name="read_github_file")
def read_github_file(repo_url: str, file_path: str, branch: str = "main") -> str:
    """Read a file from a GitHub repository to get source code context."""

    # Parse repo URL to owner/repo format
    repo_path = repo_url.replace("https://github.com/", "").rstrip("/")

    raw_url = f"https://raw.githubusercontent.com/{repo_path}/{branch}/{file_path}"

    headers = {'User-Agent': 'ErrorDebugger/1.0'}
    if GITHUB_TOKEN:
        headers['Authorization'] = f'Bearer {GITHUB_TOKEN}'

    request = urllib.request.Request(raw_url, headers=headers)
    with urllib.request.urlopen(request, timeout=15) as response:
        content = response.read().decode('utf-8')

    # Truncate large files
    lines = content.split('\n')
    truncated = len(lines) > 200
    if truncated:
        content = '\n'.join(lines[:200]) + f"\n... ({len(lines) - 200} more lines)"

    return json.dumps({
        'file_path': file_path, 'content': content,
        'repo': repo_path, 'line_count': len(lines), 'truncated': truncated
    })
This changes everything. The Supervisor parses the stack trace, reads the actual source code from your repo and passes that context to Root Cause. Analysis goes from “probably a null reference” to “line 42 doesn’t check if response.data exists before accessing .users.” Way more useful.
And the frontend can create GitHub Issues directly from analysis results. One click from error to tracked issue. Your team discusses, refines the fix and closes it when sorted. All linked back to the original analysis.
GitHub Issue created from analysis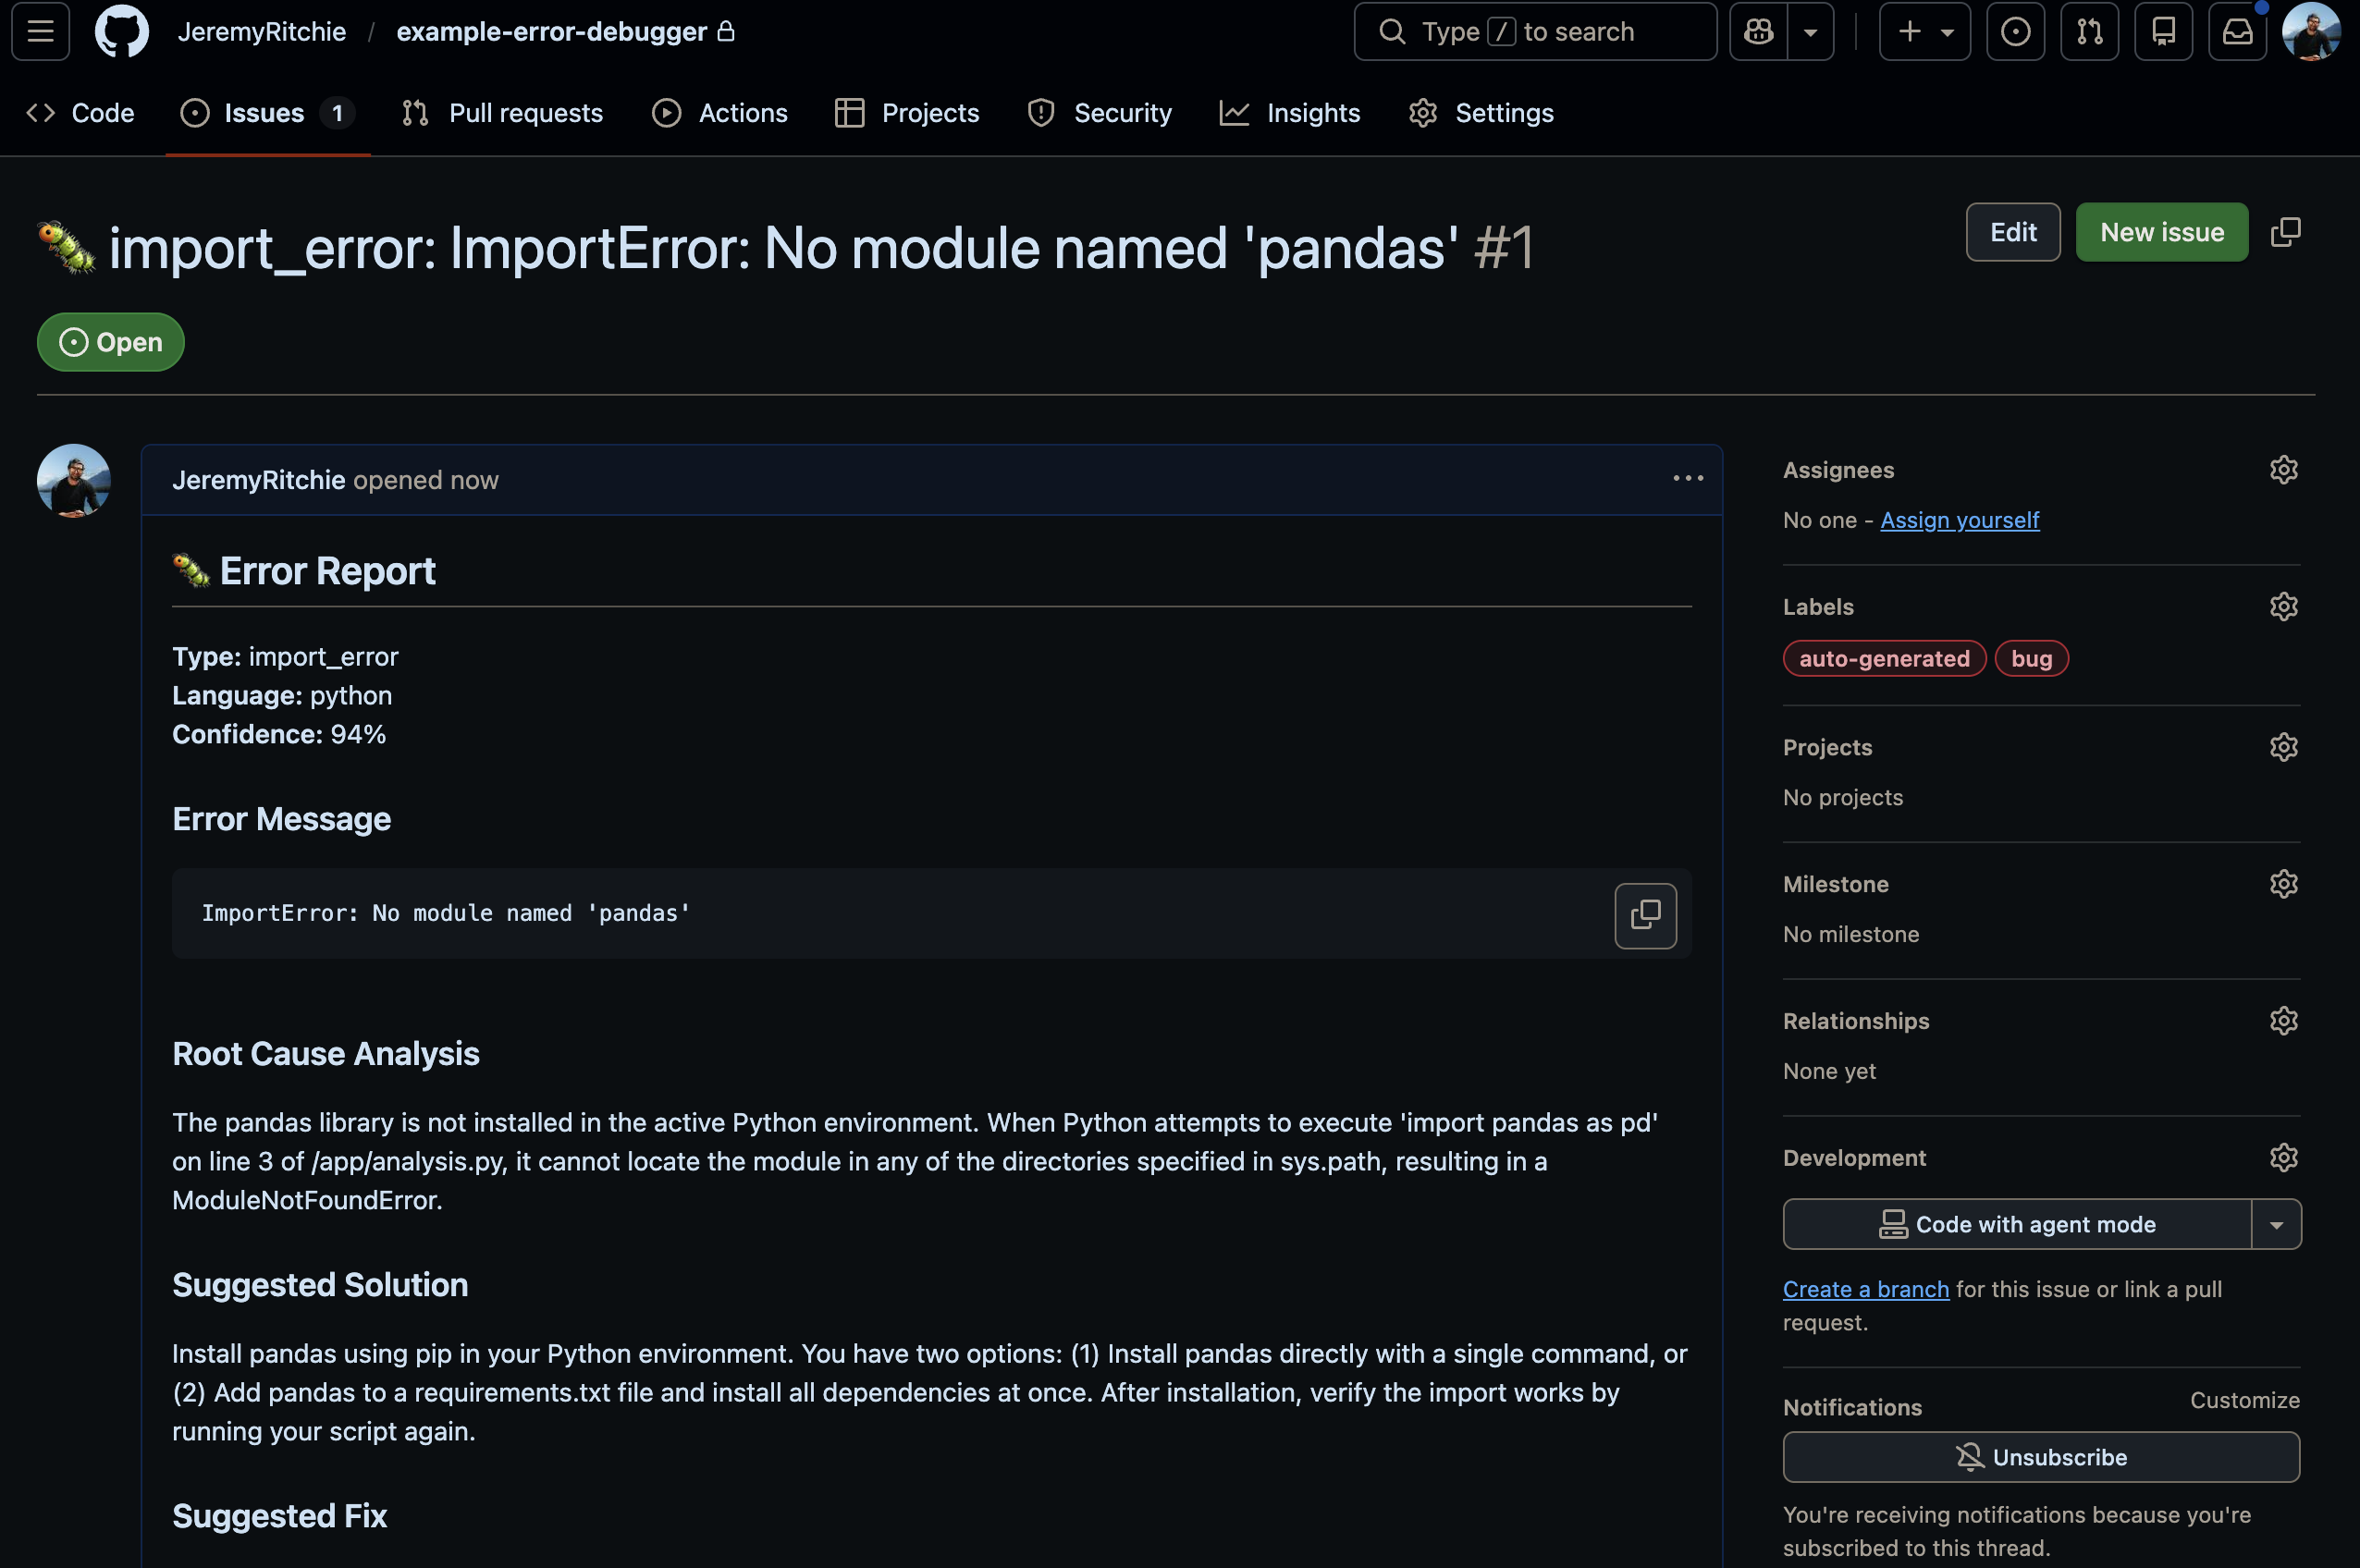
Updated Supervisor Workflow
With memory, context and stats, the Supervisor needs a smarter approach. Part 1 uses a THINK → ACT → OBSERVE → REFLECT → DECIDE loop — the agent iterates until it’s confident. Part 2 keeps that loop but adds a fast path that bypasses it entirely for known errors.
The key insight: check memory before doing expensive analysis. If we’ve seen this exact error before with a known solution, why spin up the full agent loop?
The system has two distinct code paths:
FAST PATH (memory hit):
1. Quick regex parse (no Lambda call — microseconds)
2. Search memory → match ≥70%? One LLM call to enrich the cached solution
3. Done in ~6 seconds

FULL PATH (no memory match):
1. Parse (Lambda via Gateway)
2. Security scan
3. Search memory → miss
4. Search GitHub Issues + Stack Overflow
5. Read source files from repo (if provided)
6. Root cause analysis (Bedrock Claude)
7. Generate fix (Bedrock Claude)
8. Store pattern in memory
9. Record stats
The fast path bypasses the supervisor agent entirely. Regex parse, memory search, one LLM enrichment call, done. That’s what gets you from 106 seconds down to 6.
Feature Flagging
Here’s a practical problem: you might want to deploy Part 2 features incrementally. Or roll back if memory causes issues. Hardcoding the full feature set makes that painful.
I use a simple environment variable:
# config.py
FEATURE_PART = int(os.environ.get('FEATURE_PART', '2'))

def build_tools_list():
    """Build the tools list based on FEATURE_PART."""
    # Part 1: Core agents (always included)
    tools = [
        parser_agent_tool,
        security_agent_tool,
        rootcause_agent_tool,
        fix_agent_tool,
        # Context and reasoning tools (always available)
        update_context,           # Accumulate context between agents
        get_context,              # View accumulated context
        add_reasoning_step,       # Document thinking
        evaluate_progress,        # Reflection for iterative reasoning
    ]

    # Part 2: Advanced agents and features
    if FEATURE_PART >= 2:
        tools.extend([
            context_agent_tool,      # GitHub Issues, StackOverflow search
            read_github_file_tool,   # Read source files from GitHub repos
            search_memory,           # Memory operations
            store_pattern,
            record_stats,            # Statistics
            get_trend,
        ])

    return tools
Deploy Part 1 or Part 2 with a single parameter:
# Deploy Part 1 (basic)
gh workflow run deploy.yml -f action=deploy -f feature_part=1

# Deploy Part 2 (full)
gh workflow run deploy.yml -f action=deploy -f feature_part=2
Terraform uses the same flag. Memory, DynamoDB and the extra Lambdas only deploy when feature_part >= 2. Set it to 1 and you’ve got Part 1 with zero extra cost.
Results
I threw a Python ImportError: No module named 'pandas' at the system twice.
First run: full analysis, same as Part 1 but now with external context from GitHub and Stack Overflow cited in the output. The Root Cause agent references actual issues other people had with the same error. Way better than Claude guessing from training data alone.
First run — full analysis, no memory - 106 seconds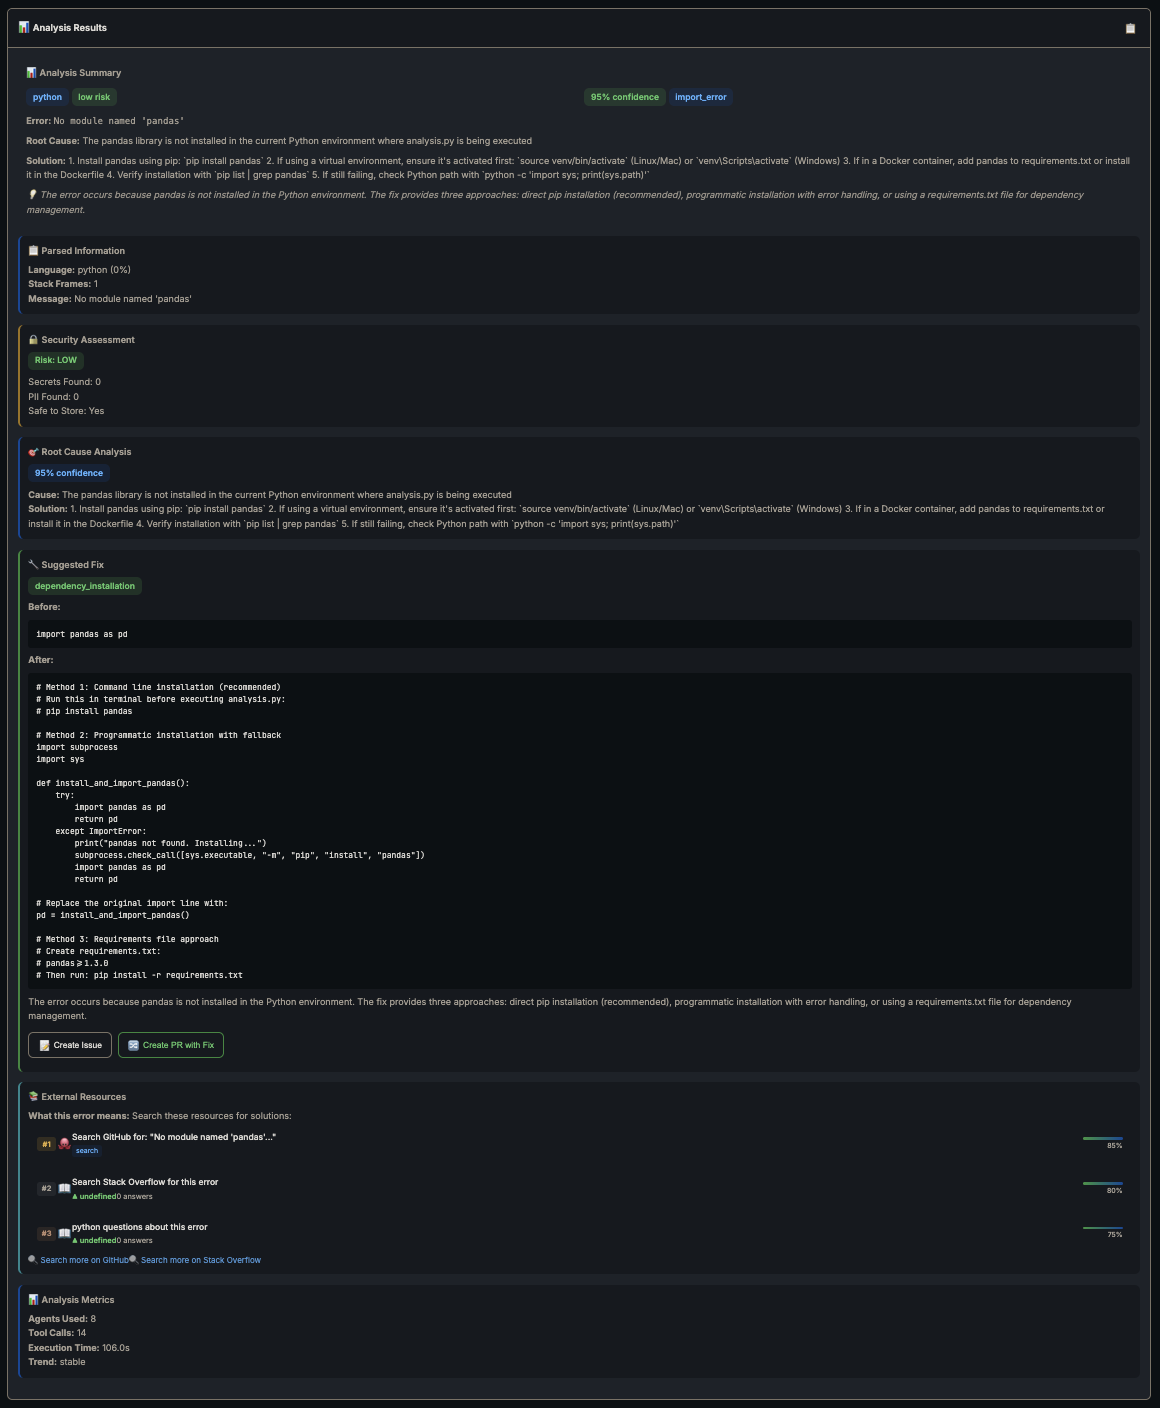
Second run — memory kicks in:
Second run — memory match found, cached solution returned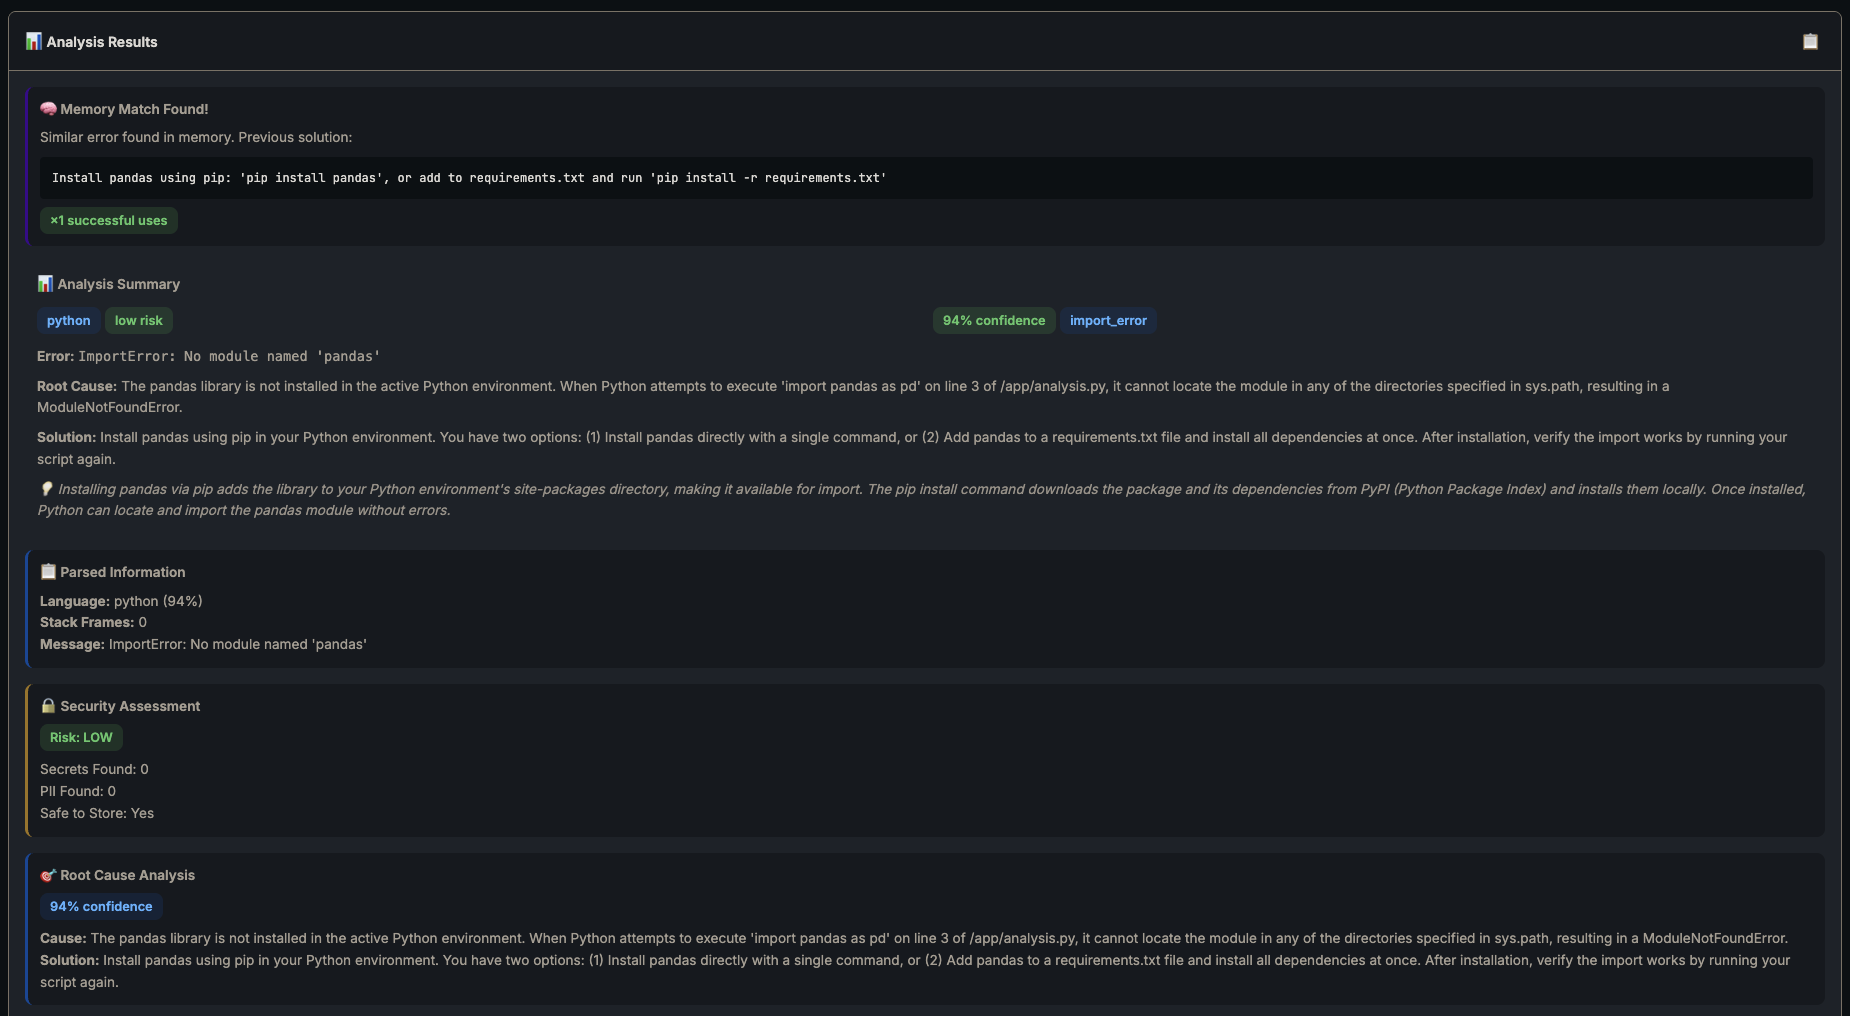
Second run — fix, external resources, 6.2s fast path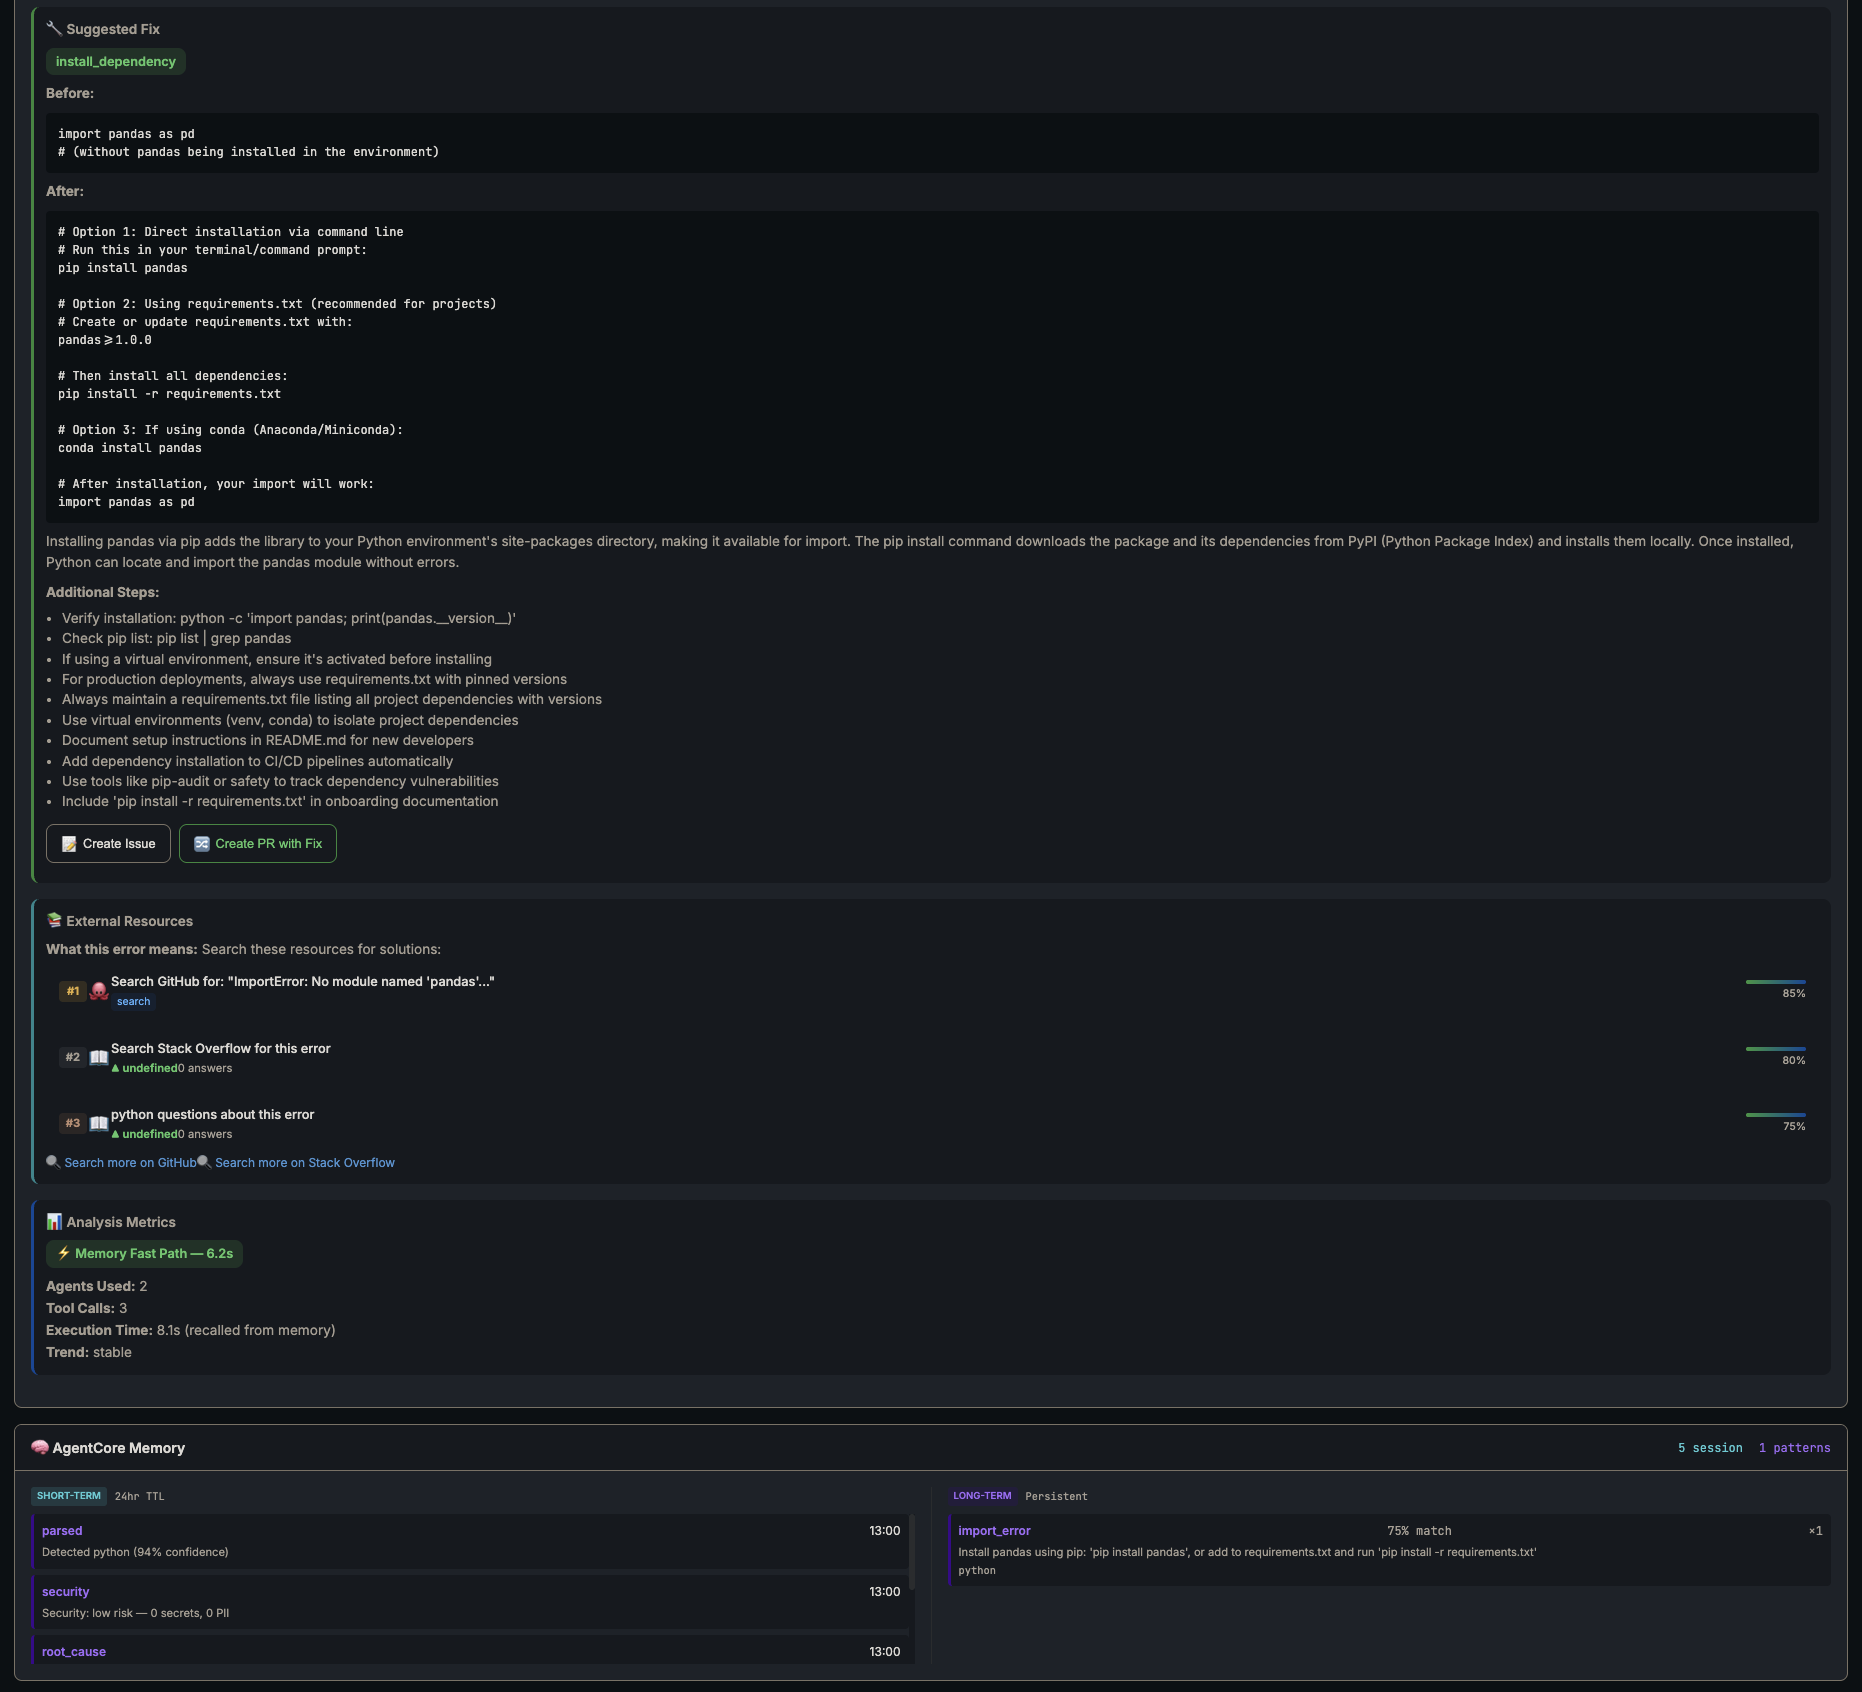
| Metric | Full Path | Memory Fast Path |
|---|---|---|
| Time | 106s | 6.2s |
| Agents used | 8 | 2 |
| Tool calls | 14 | 3 |
| LLM calls | ~8 | 1 (enrichment only) |
| Cost | ~$0.02 | ~$0.001 |
17x faster. One LLM call instead of eight. Memory pays for itself on the second occurrence of any error.
The system also cites actual sources now. The full path pulls GitHub issues and Stack Overflow questions ranked by relevance — the Root Cause agent references real discussions other devs had with the same error, not just vibes-based reasoning.
Conclusion
Part 1 was clever but forgetful. Same error twice meant full analysis twice. Part 2 sorts that. The system actually learns now.
The biggest lesson from this build? Check memory before doing anything expensive. That one decision gate — search before analyse — is where all the value lives. Shove your known patterns into Memory, let the costly LLM calls handle genuinely new problems. Your Bedrock bill will thank you.
| Component | Part 1 | Part 2 |
|---|---|---|
| Agents | 5 | 8 |
| Tools | 8 | 14 |
| Lambdas | 2 | 4 |
| Has memory | ❌ | ✅ |
| External search | ❌ | ✅ |
| Stats tracking | ❌ | ✅ |
| GitHub integration | ❌ | ✅ |
Every error the system solves makes the next one faster. That’s the whole point.
Full source code: github.com/JeremyRitchie/agentcore-error-debugger